UPDATED: The Data Behind a Changing Arts Landscape
Each year, I look forward to examining the data that reflect the lived realities of our arts and culture organizations. This year’s findings—shared at Boot Camp, and previewed earlier on this blog—paint a picture of a field that is both challenged and determined, evolving in thoughtful, measurable ways.
The SMU DataArts National Trends Analysis 2025 draws upon data from over 6,500 organizations to analyze trends from 2019 through 2024. What emerges is a nuanced story: some metrics have stabilized, others remain in flux, but across the board we see organizations making strategic choices to sustain their missions and their people.
THE MAJOR TAKEAWAYS
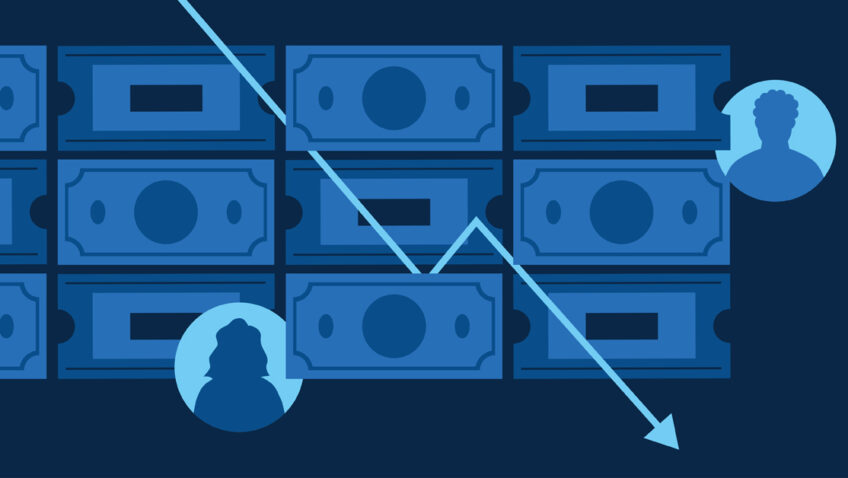
Revenue: Progress and PressurE
Funding portfolios are returning to more familiar patterns. Contributed revenue accounted for 59% of all income in 2024, showing the continued importance of philanthropic support. Yet total revenue fell below pre-pandemic levels for the first time since 2021, with foundation giving down 25%.
Large organizations saw the steepest average losses, but many smaller organizations actually reported gains. It’s a reminder that sector averages can obscure as much as they reveal.
Expenses and People: Prioritizing the CorE
Organizations reduced spending in 2024, but payments to artists declined far less than overall personnel costs. This tells me something essential: even as resources tighten, the field continues to invest in creative labor.
At the same time, staff counts have reached a six-year low—both full- and part-time roles decreased by about two positions per organization. These numbers reflect tough choices, but also adaptive management.
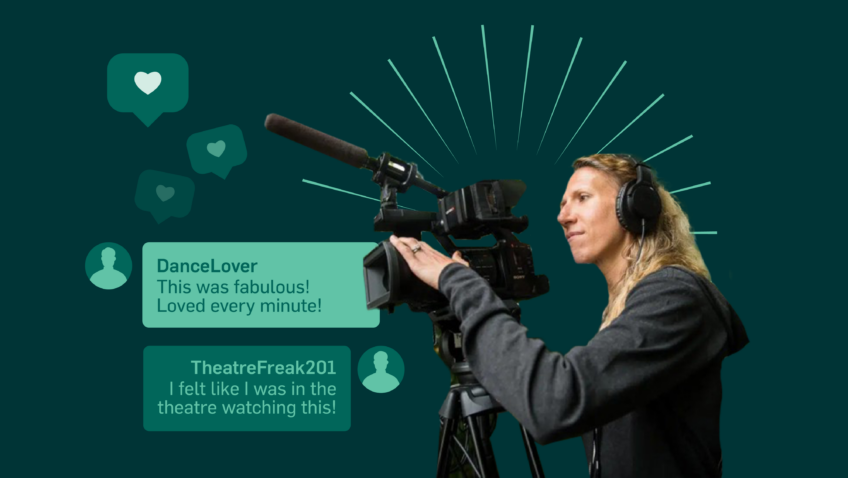
Audiences: Signs of RenewaL
Perhaps the most encouraging trend: audiences are returning. Between 2023 and 2024, paid attendance rose 13% and free attendance 22%. Organizations are finding new ways to connect with their communities, even with fewer resources.
Financial Health: Cautious OptimisM
More organizations are running deficits, yet many still maintain stronger savings than before the pandemic. Forty-two percent now have three months or less of working capital (which is an improvement from 56% in 2019). Rainy day funds built up during the height of pandemic relief funding continue to buoy many organizations.
What Leaders Should Be AskinG
As I’ve worked through this year’s data, a few questions keep surfacing:
- Are we planning for the end of extraordinary pandemic funding?
- Do our programs align with current community needs?
- What level of growth is sustainable given funding volatility?
Data helps frame these questions, but it’s up to leadership teams to explore the answers. Resilience isn’t just a buzzword—it’s a measurable force in our field. The path forward depends on how we use this information: to plan realistically, to collaborate creatively, and to continue centering artists and communities in everything we do.
EXPLORE THE FULL 2025 NATIONAL TRENDS ANALYSIS FROM SMU DATAARTS