
The New, Hidden Threat to Marketing Performance: Automated Website Traffic
As organizations continue their transition from Universal Analytics (UA) to Google Analytics 4 (GA4), there is one final deadline from Google to keep in mind: On July 1, 2024, Google is set to erase all historical UA data.
If your organization relies on historical website data, it’s important to create a thoughtful plan for exporting this information. The solution is not one size fits all, so we broke down three different export options to help you choose the method that’s right for your organization.
For those who prefer a more hands-on approach, the manual export method allows you to dive into your UA account. The process for export includes selecting a specific report in the UA interface, setting the desired date range, and exporting the data in various formats such as PDF, Google Sheet, Excel, or CSV.
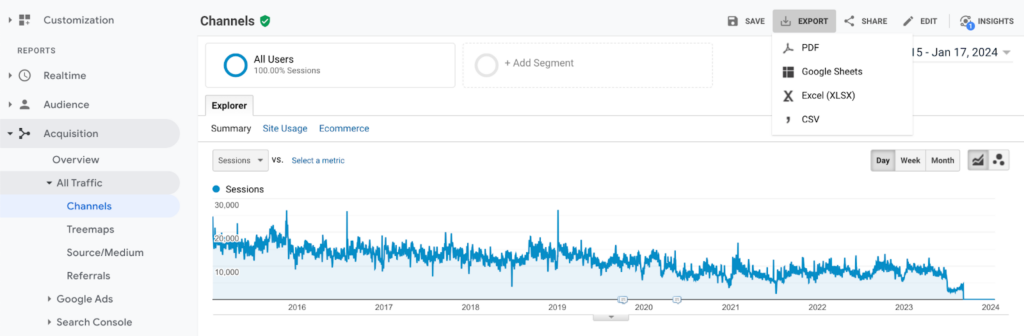
Gain access to the full historical date range for high level metrics (sessions, revenue, etc.).
Customize your report selection based on specific data needs.
Export data in your preferred file format.
The process can be time-consuming, especially for large UA accounts or organizations with multiple properties.
File types are data-heavy and lack data visualization which makes them difficult to use.
You can only export a maximum of 5,000 rows at a time, meaning it may take several exports to capture all the data.
You can only export tables with a maximum of two dimensions.
Each UA report is exported into separate files, making the analysis of data from across reports a substantial undertaking.
Large date ranges can encounter data sampling challenges.
For those seeking a more efficient solution, the UA Query Explorer provides free access to the UA API. This tool allows you to create custom queries by selecting a date range, dimensions, and metrics. The queried data can be exported as a TSV (Tab-Separated Values), which can then be imported into Google Sheets and Excel.
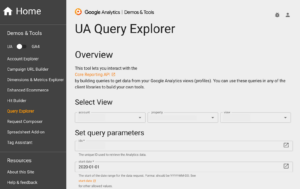
Customize data pulls based on specific dimensions and metrics of interest for your organization.
Export tables of up to 9 dimensions and 10 metrics.
Faster than the manual export method.
Requires a transformation of the file into a usable format (Google Sheet or Excel) after export.
Similar to manual export, file types are data-heavy and lack data visualization.
No access beyond the date range specified in your UA data retention settings.
You can pull a maximum of 10,000 rows per request.
The tool will alert you if the data is sampled or not, but will not display the sampling rate.
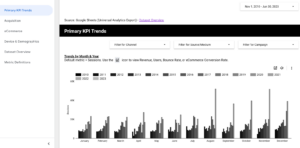
For those looking to delegate the export process, the UA Export project with CI takes care of the heavy lifting. We will export key tables, including page, ecommerce, and demographic data. The delivered raw data is accompanied by Looker Studio dashboards, providing a visual representation of your data for better understanding and analysis.
Frees up time for your team to focus on other projects.
Deliverables include dashboards that visualize your UA data and make it more usable for your team.
Similar to the UA Query Explorer, there is limited access beyond the date range in your UA data retention settings.
Involves a one-time cost of $2,000.
Ultimately, the most appropriate UA export solution depends on your priorities, resources, and the significance of historical data in your decision-making. These factors will guide you toward the option that best fits your organization.
Get in touch with our Analytics team to determine the best export method for your organization and discover opportunities to leverage historical UA data.


![Managing User Consent On Your Website [Updated 2025]](https://capacityinteractive.com/wp-content/uploads/2026/04/2026-Blog-Header-Brand-Redesign-JB-copy-36-scaled-848x478.jpg)