How Do I Compare UA and GA4 Reports?

Ask CI

Ally Duffey Cubilette AUTHOR: Ally Duffey Cubilette
Oct 18, 2023
5 Min Read
Listen

This summer, the digital marketing world was buzzing as Google sunset Universal Analytics (UA) and officially migrated to Google Analytics 4 (GA4). Many of you embraced the mandatory shift in July and are about to dive headfirst into your inaugural seasons with GA4.

But wait! How do you compare website performance year over year when you’ve switched to an entirely new system? Fear not, fellow data enthusiasts—let’s dive into some key differences between UA and GA4 measurements so you can better monitor changes in site performance.

FIRST THINGS FIRST

Let’s start with a quick disclaimer: While the tips below can help you compare UA and GA4 data more easily, don’t expect apples to apples for every metric.

It’s important to remember that GA4 is a different tool and uses a different methodology for capturing data. Discrepancies for key metrics are totally normal, even when metrics have the same name in both platforms (like “sessions” and “users”). Don’t panic if you notice some variation in results by campaign, source, medium, and channel.

  • Pro Tip: If you implemented GA4 tracking early and captured data in both systems side-by-side, you can use that data to estimate the percent change in key metrics.

USERS

In UA, the metric users shows the total number of users who visited the site. But when you see “users” in the GA4 interface, that metric is showing active users, or the number of users who’ve had engaged sessions. (More on that below!)

  • What Changed: GA4’s focus on active users results in a more meaningful look at website traffic. You’re no longer counting visitors who stumble onto your site and leave in under 10 seconds. Just keep in mind that this new methodology means your user counts might look lower in GA4 than in UA.
  • Pro Tip: UA identifies users based on cookies that are device- and browser-specific, but GA4 can utilize several additional methodologies for identifying users if you’re willing to customize the configurations. These can be helpful to understand cross-device behavior and future-proof your measurement to be less reliant on cookies.

SESSIONS

You can think of sessions as the number of visits to your website. Sessions are measured similarly across UA and GA4, and in both systems they typically end when there’s more than a 30-minute period of inactivity.

  • What Changed: Unlike with UA, GA4 sessions are not restarted at midnight or when new campaign parameters are encountered. GA4 properties also use a statistical estimate of the number of sessions that occurred on your site while UA properties do not. The result is a more efficient session count with high accuracy and low error rate.

ENGAGEMENT

R.I.P. bounce rate. GA4 introduced new sophisticated metrics to reflect site performance: engaged sessions and engagement rate. Engaged sessions are visits to the site that include more than one page, last longer than 10 seconds (unless otherwise customized in Admin settings), or include an event marked as a conversion.

Engagement Rate = Engaged Sessions ÷ Sessions 

  • What Changed: In UA, we often referenced bounce rate to understand how qualified our site traffic was and how well our landing pages performed. Bounce rate was the percentage of users who came to the site, viewed only one page, and left.
  • Not only was this a glass-half-empty way of looking at site performance, it was not fully reflective of user behavior. Perhaps we created exceptional, content-rich landing pages, giving users plenty to learn and explore on a single page. Bouncing from a page like that is not necessarily a bad thing!
  • GA4’s engaged sessions and engagement rate offer more glass-half-full metrics. They take into consideration significant behaviors or extended lengths of time spent on a page.
  • Pro Tip: You may find the metric “Bounce Rate” in GA4, but don’t be fooled! This is calculated simply as (1 – Engagement Rate) and is not a direct comparison for the previous bounce rate methodology. GA4 bounce rate will be lower than in UA, because sessions lasting more than 10 seconds or with a conversion event are not included.

PAGEVIEWS

Just like the name suggests, the pageview metric measures the total number of pages viewed on your site. The methodology for pageviews is similar in UA and GA4 so any discrepancies should only be within a few percentage points.

  • What Changed: Unlike Universal, GA4 allows you to track app and website data into the same property. Apps are rare for our industry, but keep in mind whether app traffic might contribute to discrepancies in your UA comparisons.
  • Pro Tip: Trouble locating pageview data in GA4? You can find the report under Life Cycle > Engagement > Pages & Screens. Depending on how you initially configured your property, you may instead see the headline of Business Objectives, then look for Examine User Behavior > Pages & Screens.

23-10 GA4 Part 2 Pages and Screens

CAMPAIGN TRACKING

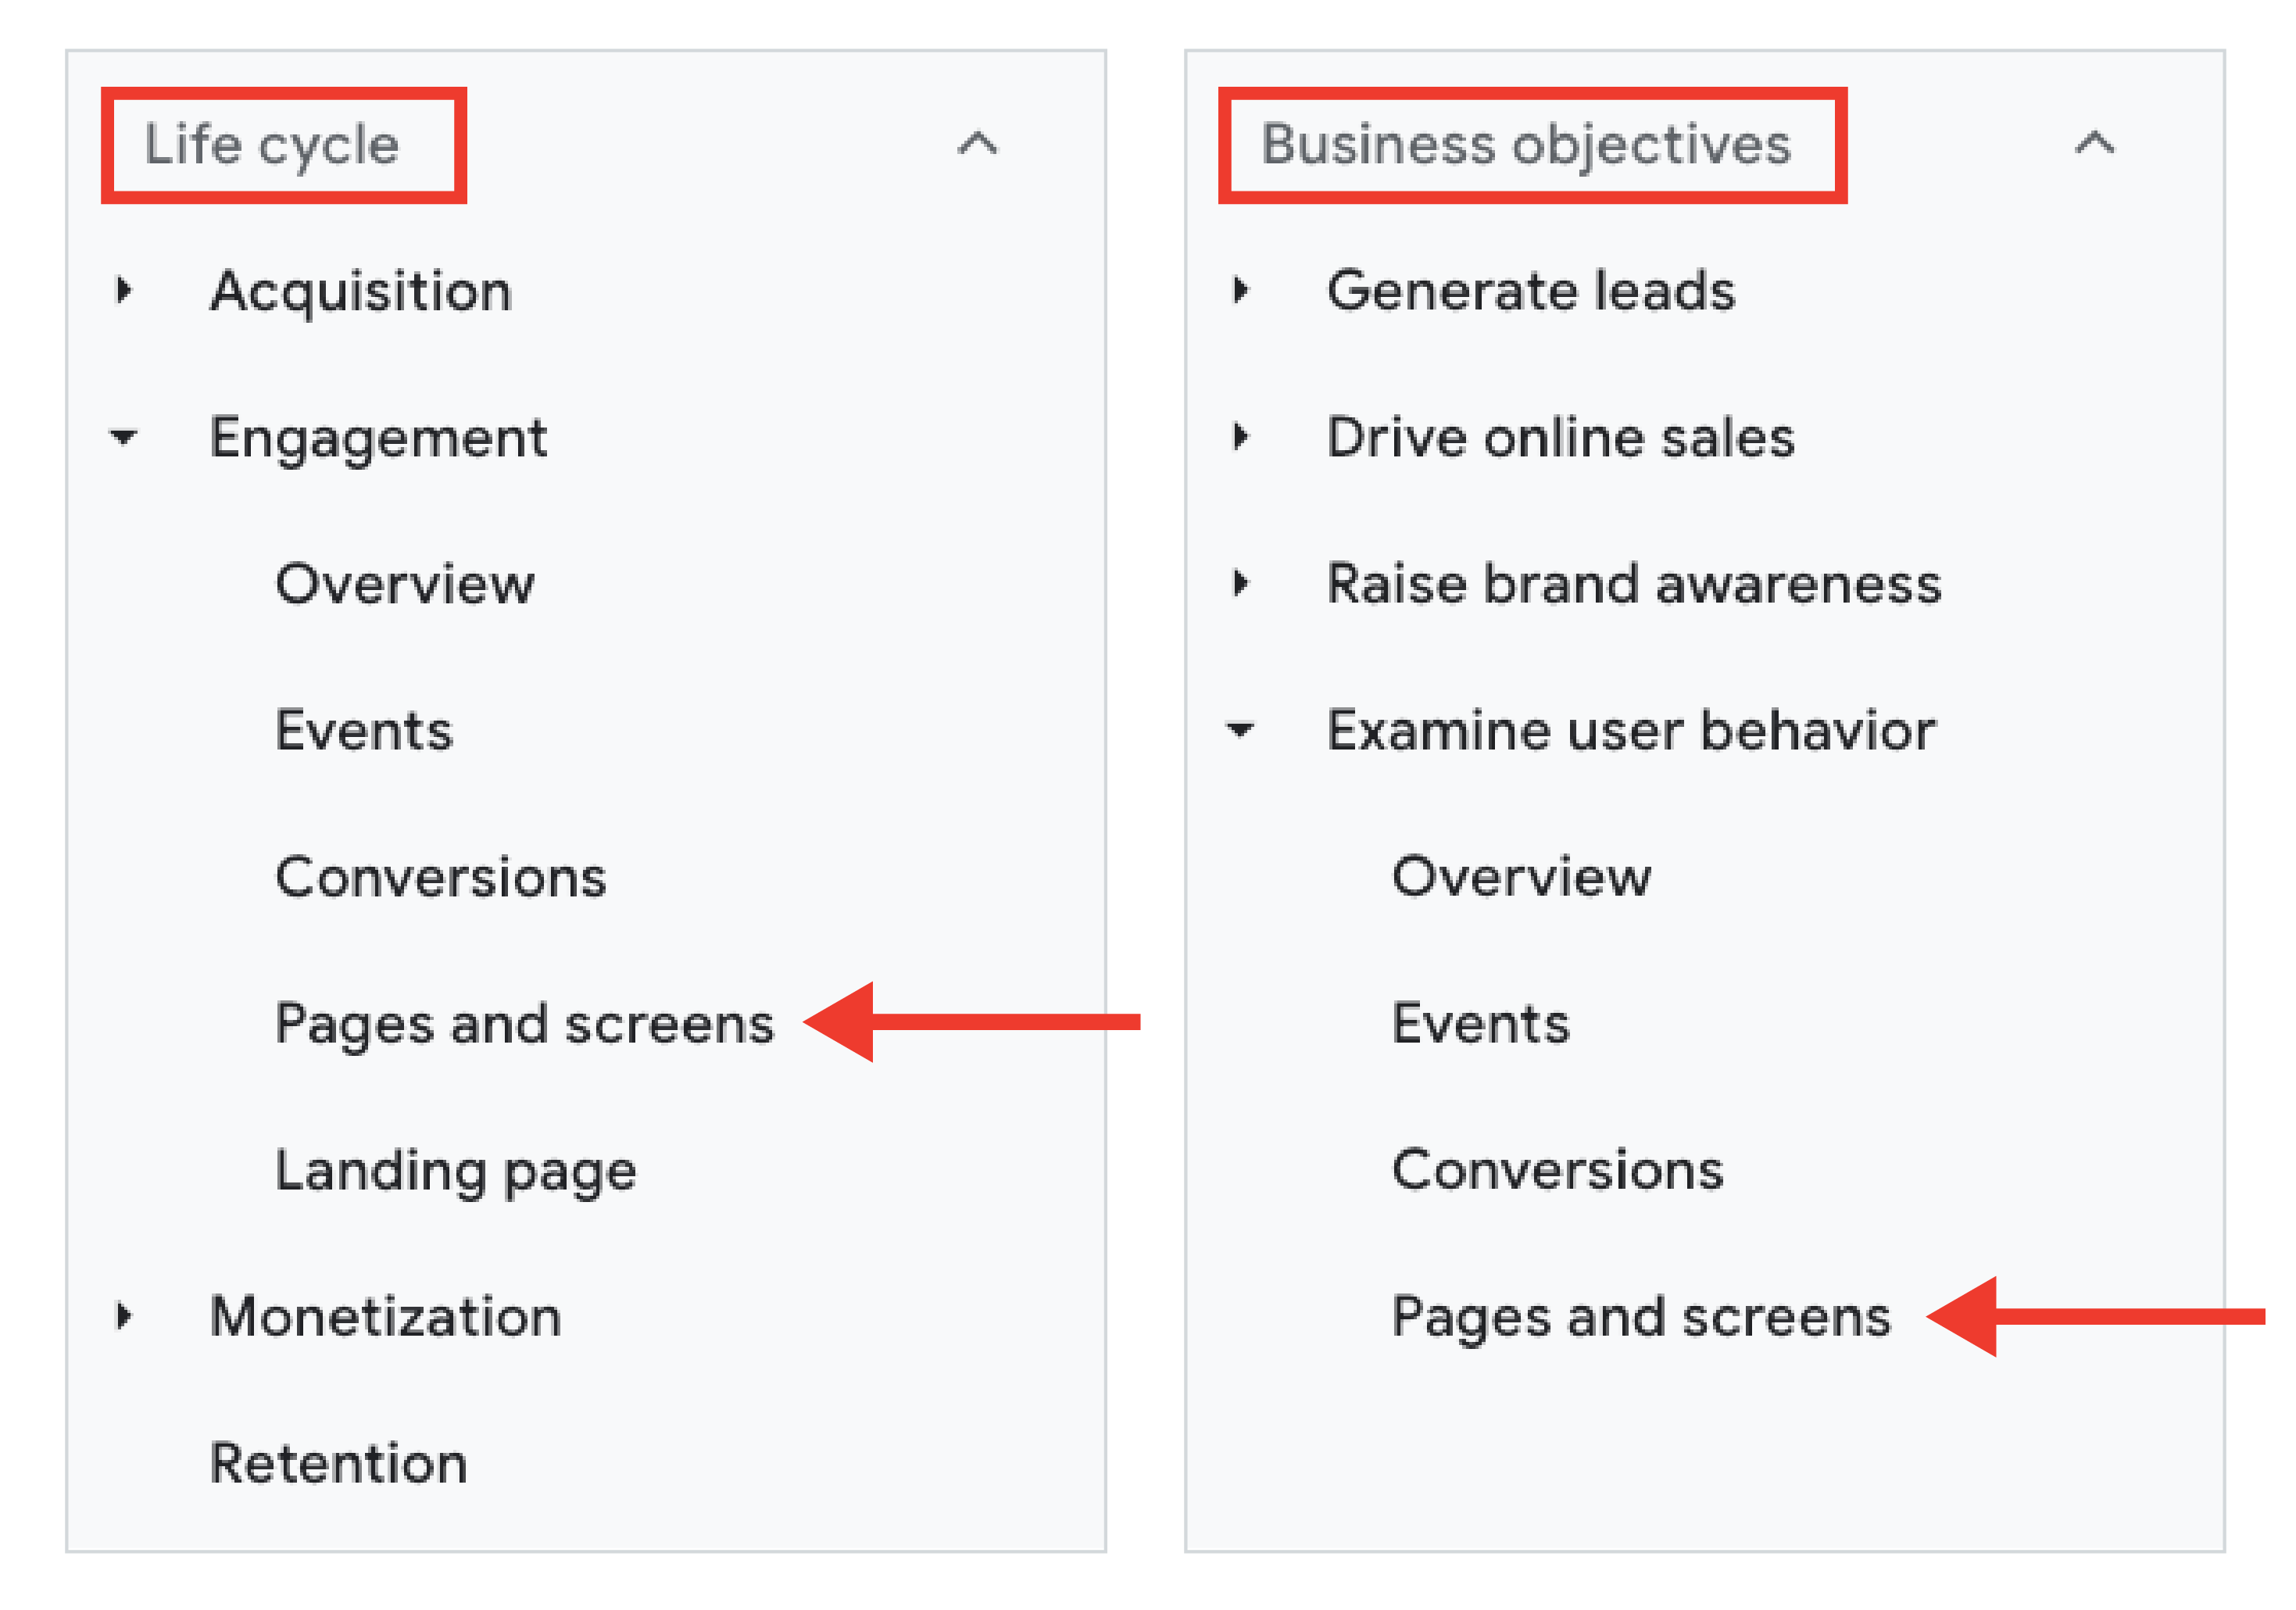
Campaign tracking shows the amount of web traffic and conversions attributed to various advertising efforts. Like UA, GA4 relies on trackable links to unlock key details about each session, including which campaign drove a user to your website; where that user clicked; and what particular actions they took (like purchasing tickets).

  • What Changed: Not much. The data just lives in a different place. You’ll find campaign traffic in the “Traffic Acquisition” report in GA4. This report is most comparable to the “Channel” reports in UA.
  • Pro Tip: Don’t skip the step of setting up trackable links for your campaigns! Without them, traffic will be categorized based on the referral URL, which may not be enough to understand your various campaigns, placements, or posts.
  • And don’t use trackable links to measure internal elements of your website! This can affect the integrity of your campaign tracking.

MEASUREMENTS THAT MATTER

If you’re used to UA, adapting to the nuances of Google’s latest and greatest analytics system might require some time and effort. But GA4 has emerged as a more powerful tool than its predecessors. Learning how to understand and harness data insights through GA4 will bring you that much closer to creating better digital experiences for your audiences.