
How We Used Google Analytics Data To Inform Utah Shakespeare Festival’s Website Redesign
Services We Provided:
Website Analytics & Strategy39%
lift in people using the global navigation on mobile
75%
increase in pageviews per session on mobile
10-30%
increase in conversion rate on mobile
The Utah Shakespeare Festival (USF) is over 60 years old and offers a gorgeous site for theater in the mountains of southern Utah, taking advantage of the summer’s high tourist season at the area’s national parks. From June through October, USF presents both classical and contemporary works in three different theaters.
A seamless website experience is critical for any arts organization, but it’s particularly important for those that, like Utah Shakespeare Festival, rely on tourists and travelers for a sizable chunk of their audience. These are folks planning for ticketing and venue logistics ahead of time, who need to be able to do their research with minimal friction.
In 2020, Capacity Interactive partnered with USF for an analytics implementation and deep dive analysis of their website data prior to their redesign, which would launch in March 2022 (yes–on top of dealing with Covid shutdowns and restrictions, the USF team built a new website during the pandemic!). The findings informed critical elements of the redesign that we can now see have impacted engagement rates and user behavior.
Utah Shakespeare Festival wanted to approach their website redesign in a data-driven, user-centric manner. By focusing on the users’ need for mobile-friendly navigation in their redesign, they were able to significantly increase engagement from mobile users, who make up an increasing majority of all website visitors. More critically, they had a significant increase to mobile conversion rate—their main objective!
While the navigation changes were among many site optimizations and cannot take full credit for the increases in mobile engagement and conversion, they certainly had a major impact.
The Deep Dive
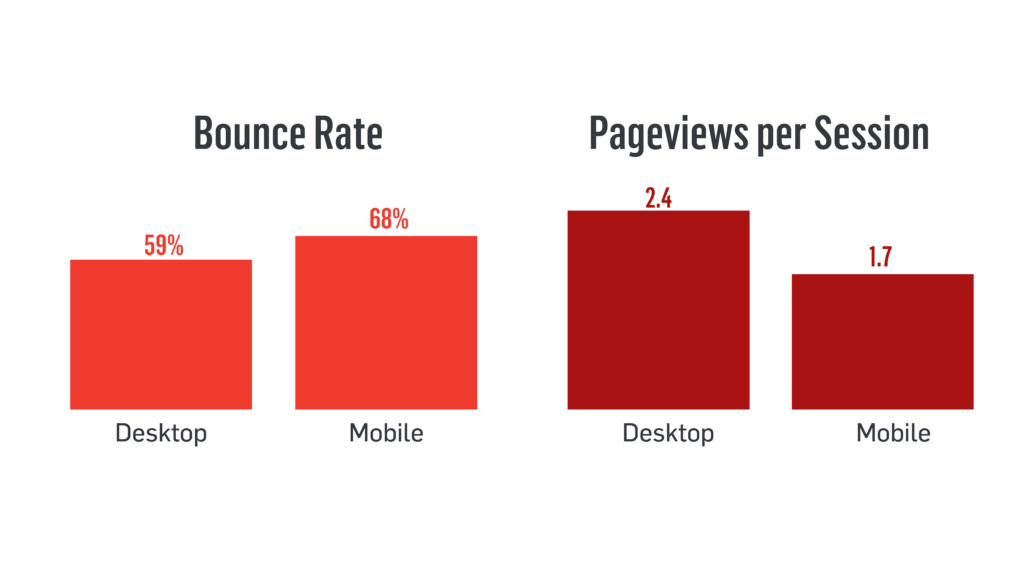
After CI completed USF’s analytics implementation (in Universal Analytics, as this was in 2020), one of the most notable findings from the deep dive analysis of the website data was the enormous delta between people utilizing the global navigation menu on desktop (17.2%) vs. on mobile (5.7%). When we think about the function of a good user experience, one of the key attributes is helping users navigate the website, and the main module we rely on for that is the global nav. Mobile users were being underserved with the old website, and this had a major ripple effect on key engagement metrics:
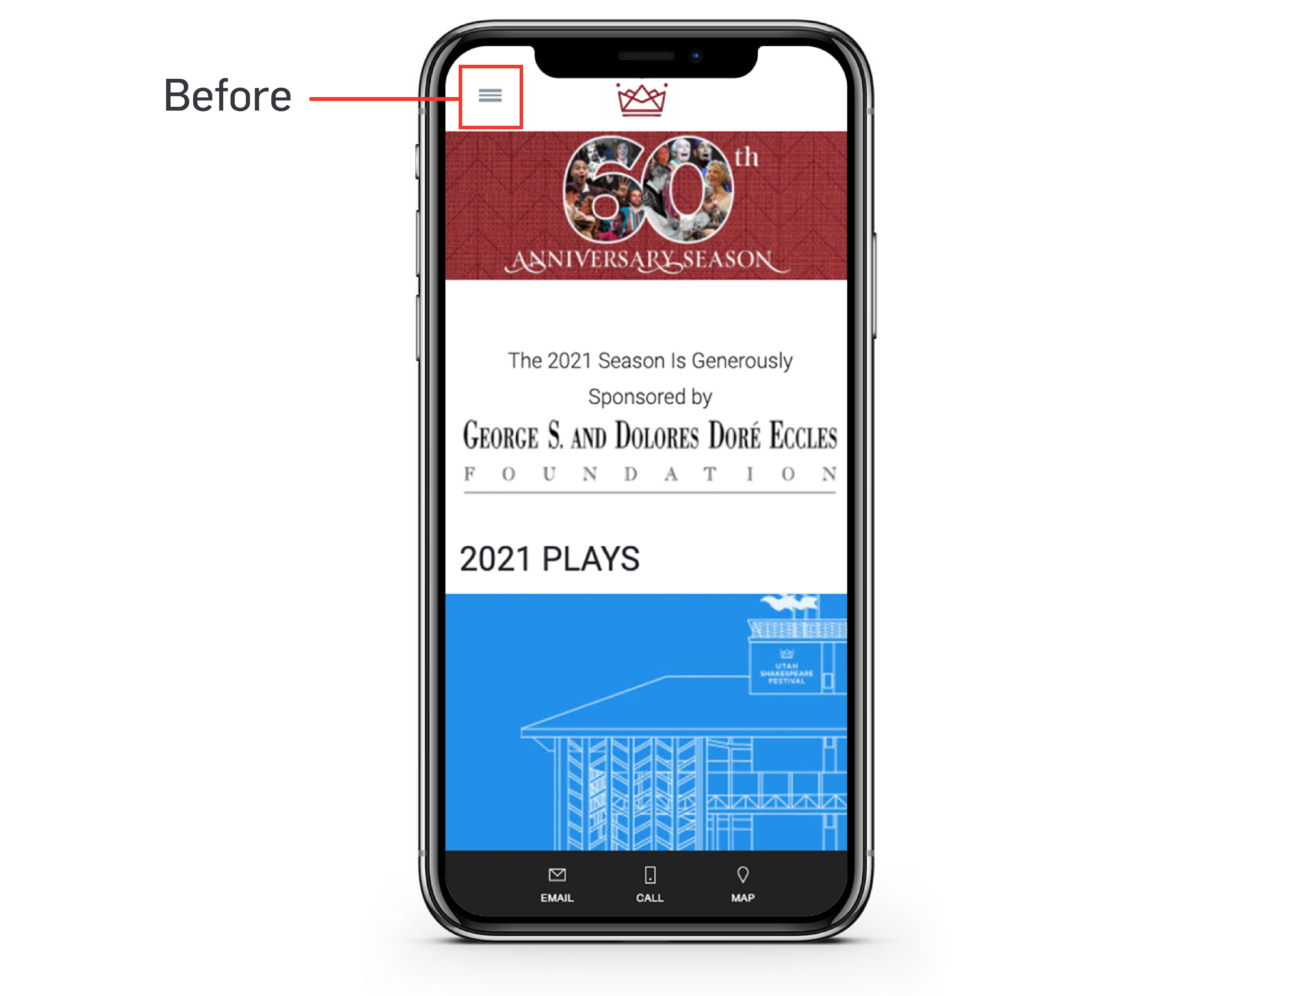
When reviewing the design of the old site, it was not overly surprising to see why mobile users were less likely to use the global nav: its components were hidden in the ubiquitous hamburger menu. Using the data from our custom implementation, we were able to measure that only 8% of mobile users expanded the hamburger. Or, put another way, 92% of mobile users never opened the hamburger to see what navigation options were available to them.
Because mobile traffic was (and is) on the rise, the mobile experience had to be prioritized during the redesign, and we knew that a new approach to the global nav could have a big impact (especially since the module lives on every single page):
THE NEW MOBILE SOLUTION
Utah Shakespeare Festival went bold with an extremely lean and effective mobile navigation: they completely eliminated the “hidden hamburger” that so many web designers are partial to in a mobile environment. Instead, they prioritized the most important menu items in a format that is consolidated enough to persist as a user scrolls, without taking too much of the webpage’s real estate:
USF had extensive and tough internal conversations to decide what would have to get cut from the global nav – not an easy process, but one that is necessary when designing for devices with less real estate than desktop computers – and focused on the users’ needs, not on their internal stakeholders’ preferences.
THE IMPACT
- Whereas in 2020 when mobile users were one-third as likely to use the global nav, as of 2024, the percentage of mobile users who use the global navigation has now surpassed that of desktop users!
- This has contributed to a 75% increase in session engagement (using pageviews per session as a KPI).
- The increase in engagement has helped improve conversion rates, anywhere between 10% and 30%. (Calculating conversion rate for USF is a bit complicated so we took two approaches—one model shows a 10% increase, the other a 30% increase). Even the lower end of this range, 10%, is a huge lift and has a major impact on ticket sales.
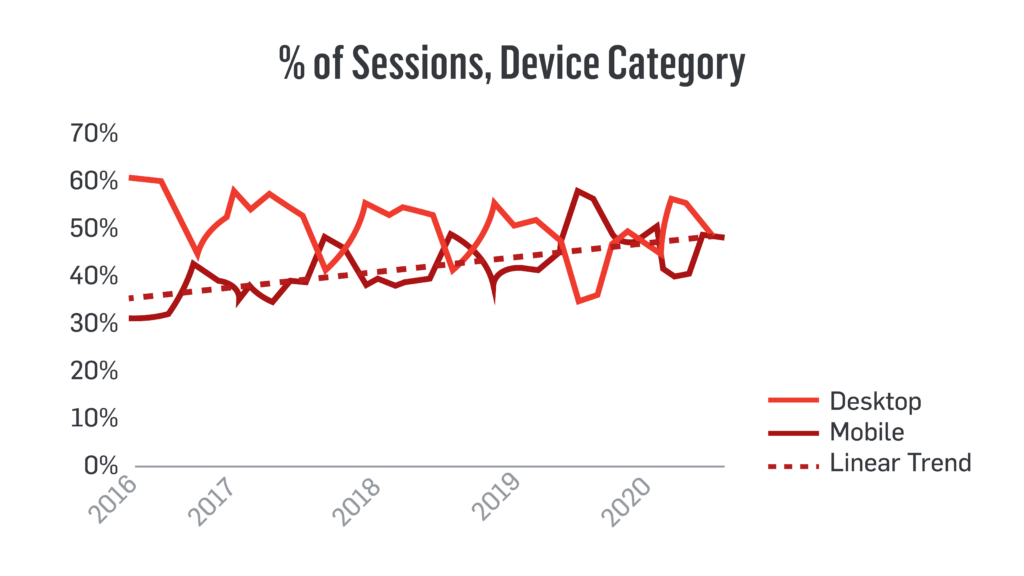
- Mobile traffic now makes up 54% of users for USF, compared to 48% in July 2020.
- The majority of campaign traffic is on mobile devices—having a mobile website that better engages and converts users has a direct impact on campaign performance.
Transformation at an Organizational Level
Beyond this individual analysis and design change, the USF team leveraged the redesign period and new measurement infrastructure to transform the way they utilize data. Prior to the redesign, they didn’t have data that they trusted, and as a result sparingly used it. Now, they are an organization that captures incredible data, receives automated dashboards to measure KPIs, and strives to conduct periodic analysis and A/B tests to keep learning about the user experience and improve website performance.
TAKEAWAYS
- Approach changes to your website with a focus on user-centric design, and make decisions based on data. Proper measurement and analysis will help you ideate and advocate for the types of changes that impact your bottom line.
- It’s OK to start small. Optimizing your website can sound intimidating–but it can be broken down into a collection of smaller projects that are more manageable! This is an example of one change made within a larger redesign, but could have been approached as its own (smaller) project focused on site navigation.
- Remember that conversion rate is impacted by engagement rate. Your marketing campaign performance—regardless of marketing channel—is also impacted by both of these metrics,so optimizing these on your website will also pay off in improvements to campaign results.
Working alongside Capacity Interactive has been truly transformative. CI's profound expertise in analytics implementation and in-depth analysis significantly influenced the shaping of our website strategy and design, resulting in exceptional outcomes that surpassed our initial projections. They are an invaluable partner as we continue refining our web product to new heights.

Ready to Get User-Centric With Your Site?
Explore more

49% Average Click Rate
Boston Gay Men's Chorus