Arts Marketing Myths: Search Grants, Retargeting, and Influencers
Note: This post was originally published in June 2023 and updated in July 2025.
When you think about digital marketing campaigns, return on investment (ROI) likely comes to mind. But what happens when you’re running an attendance, membership, or registration campaign, and purchases largely don’t take place online or aren’t trackable?
Cultural organizations often find themselves in this predicament. Whether it’s onsite admission, off-platform registration, or pre-sale buzz, the data gaps are real.
At CI, we’re obsessed with measurement, even in scenarios that seem unmeasurable. Enter: proxy metrics. A proxy metric is something you can track that represents or approximates the value of your intended outcome. Let’s look at how we use smart, strategic proxy metrics to measure campaign performance for the cultural organizations we work with.
We rely on website views as our key performance indicator (KPI) to approximate attendance driven by digital campaigns. We build out tracking to record specific page visits on a user’s journey after seeing one of our ads. For example, did someone visit the calendar or the “Plan a Visit” page? Did they click to learn more about a specific exhibition? These actions are pretty good indicators of intent to visit.
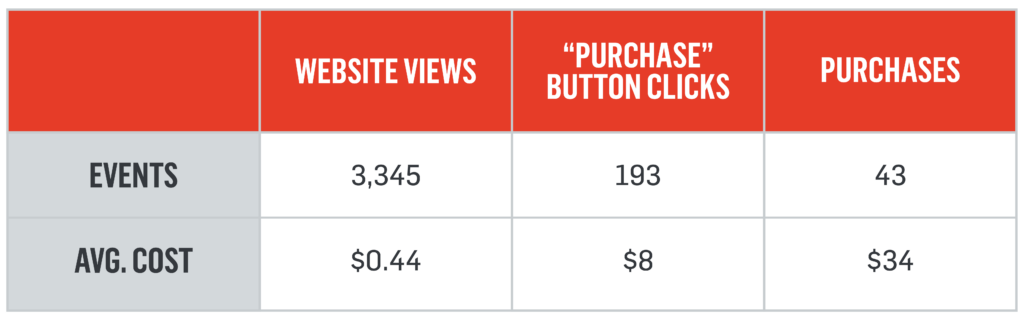
 In Action: We work with a small academic museum that only charges a nominal admission fee upon entry for those unaffiliated with the college. We regularly run short flights on Meta promoting general awareness of the museum and rely on proxy metrics like website views to measure campaign success. In December, the museum ran a week-long campaign with ads that featured a visually striking special exhibition and linked to that exhibition’s landing page.
Even when we can see online purchase data, we rarely see the complete picture. Most museum visitors purchase admission upon arrival. (One museum we work with estimates that only about 20% of their visitors buy online!) And sometimes ticketing platforms don’t have the proper infrastructure to allow for accurate tracking. But luckily, we’ve found a workaround.
In these scenarios, we continue to use page views as a strong approximator, but we also introduce another proxy metric: clicks to the ticketing platform. We can build a custom solution that tracks every time someone clicks on the “purchase” button on a museum’s website to bring the user to the ticketing platform.
Sometimes success means getting ready for future conversion before a sale even begins. That’s where lead generation campaigns come in. These efforts are particularly helpful when registration or ticket sales aren’t live yet, but building a list now will pay dividends later.

When organizations can’t track registrations directly (whether due to technical limitations or offline processes) leads become a critical success metric.

There’s no one-size-fits-all approach to reporting campaign success. Every organization has different goals, limitations, and backend systems—which is exactly why our team is so committed to finding the right strategy, no matter the tracking scenario.
Whether it’s website behavior, ticketing clicks, or lead generation, we provide cultural organizations with custom-fit measurement solutions that give a clear picture of performance (even when the data isn’t crystal clear).
Let’s talk about how we can use proxy metrics to make sure your digital campaigns are measurable, meaningful, and set up for success.