The New, Hidden Threat to Marketing Performance: Automated Website Traffic
 AUTHOR:
Ally Duffey Cubilette
AUTHOR:
Ally Duffey Cubilette
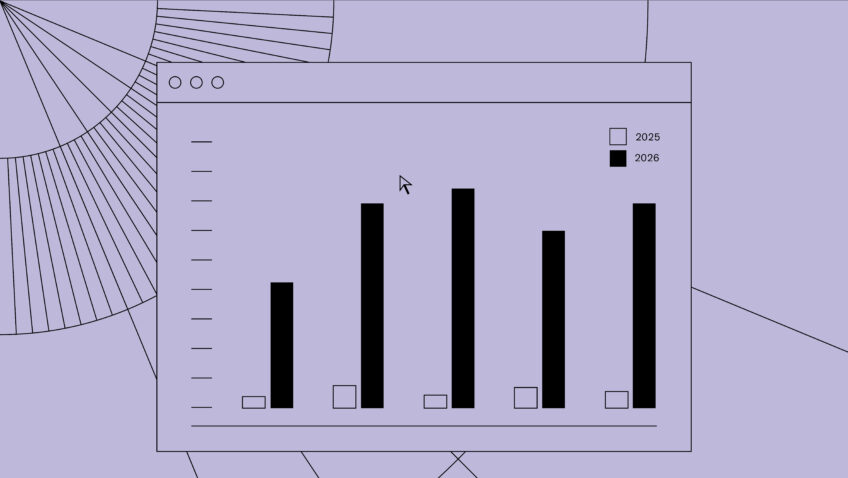
When website traffic shifts—up or down—it’s tempting to make quick conclusions. A drop in visits must mean marketing is underperforming, right? Not always. In fact, surface-level numbers often mask a much richer story.
In one recent client analysis, we noticed that overall visits were down, but the traffic that did arrive was 29% more engaged and seven times more likely to convert. This is a huge win that could easily have gone overlooked—high-quality traffic beats high-volume traffic every time. That’s the kind of nuance leaders miss when data isn’t fully unpacked.
“High-quality traffic beats high-volume traffic every time.”
Interpretation Tip #1: Don’t stop at “up” or “down.” Always ask: what kind of visitors are driving the change?
Website data is never just about the website. It’s shaped by programming, campaigns, and the channels driving traffic. For cultural organizations especially, big swings in site visits often reflect programming variation—not necessarily marketing missteps.
For example:
At CI, we always encourage arts and culture organizations to benchmark against themselves, but there’s a right way to do it. We recommend comparing results against similar past programs rather than broad year-over-year totals. Context makes the difference between reactive conclusions and informed strategy.
Interpretation Tip #2: When reporting to leadership, normalize data around major programming or seasonal trends. It prevents false alarms and builds trust in the analysis.
Looking across devices, we often see a mismatch between where visitors arrive and where they convert. In one recent analysis of client data, we saw that 65% of visits came from mobile, but desktop conversion rates were more than double. That’s a clear signal: mobile pages need optimization, especially for campaign-driven traffic.
Improving the mobile experience isn’t just a UX project—it’s a revenue driver. It’s unlikely mobile conversion rates will equal that of desktop, but iterative improvements to reduce friction in the mobile experience can drive incremental revenue, more satisfied audiences, and more dollars in the bank. If mobile is where audiences arrive, it should also be where they convert.
“Iterative improvements to reduce friction in the mobile experience can drive incremental revenue.”
Interpretation Tip #3: Segment your conversion funnel by device. You’ll uncover opportunities that blended averages hide.
The real value of website analytics isn’t in the data itself—it’s in the clarity it gives decision-makers. By uncovering what drives engagement, identifying which channels need refinement, and pinpointing where friction exists, website analytics becomes a roadmap for action.
For marketers, that means making the case for smart investment, which includes investing in improving your website. It’s not just about advertising dollars and driving traffic to the site, but optimizing your web experience to better engage new audiences and drive stronger conversion rates. For leadership, improving the overall site means your advertising dollars can be more effective.
At CI, we believe that using your website data is about more than just dashboards—it’s about deeper analysis that informs decision-making. By helping cultural organizations untangle the variables behind performance, we make data meaningful and actionable.
Want to turn your analytics into strategy? Our Website Analytics services can help you uncover the insights behind the numbers—and use them to drive smarter results.


![Managing User Consent On Your Website [Updated 2025]](https://capacityinteractive.com/wp-content/uploads/2026/04/2026-Blog-Header-Brand-Redesign-JB-copy-36-scaled-848x478.jpg)