The New, Hidden Threat to Marketing Performance: Automated Website Traffic
 AUTHOR:
Ally Duffey Cubilette
AUTHOR:
Ally Duffey Cubilette
If you’ve ever opened GA4 and felt a little lost, you’re not alone. For many arts and cultural marketers, making sense of the platform can be tricky—and when key terms are misunderstood, it can lead to frustrating missteps (see Part 1 here).
This post breaks down a few of the most commonly misunderstood traffic source dimensions in GA4. Dimensions are non-numeric attributes of your data. Dates, URLs, geolocations, and traffic sources are all dimensions. All reports in GA4 break down metrics like sessions, views, or conversion rate by dimensions to understand key aspects of your data.
You can explore the traffic source dimensions in the “User acquisition” and “Traffic acquisition” reports in GA4.

These reports have different “scopes” or perspectives on your data. The “Traffic acquisition” report is session-scoped and helps you understand the attributes and behavior of a specific visit to the site. The “User acquisition” report is user-scoped, and helps you understand the characteristics and behavior of a single user across one or more visits.
Let’s look at one dimension—campaign—and how these scopes can be interpreted.
Note: For more information about how these traffic source dimensions like campaign, source, and medium can be populated to better capture clicks from across your marketing efforts, check out our blog on Mastering UTM tracking!
This is one of the primary dimensions in the Traffic Acquisition report and helps you understand what people did directly in a single visit after clicking through a campaign.
Click the video below to see how to access this dimension in GA4:
Session campaign + sessions: how many visits originated by clicking from this campaign
Session campaign + views: how many pages did users view in their visit after clicking from this campaign
Session campaign + session key event rate: what share of visits that originated by clicking from this campaign complete a key event (like purchase) in that same visit
This is one of the primary dimensions in the User Acquisition report and helps you understand which campaign first* brought a user to the site and any subsequent behaviors, potentially across multiple visits or sessions.
*Note: GA4 identifies returning users based primarily on cookies, which are specific to a device and not reliable over longer periods: meaning, GA4 will only consider subsequent visits that happen on the same browser/device and usually within just a few days.
First user campaign + new users: how many new users were driven to the site by the campaign (see note above about how GA4 identifies users)
First user campaign + sessions: how many visits the user made to the site after clicking through this campaign, including return visits that could have originated from different traffic sources.
First user campaign + views: how many pages did users view over the course of their first and any subsequent visits.
First user campaign + first user key event rate: what share of visits that originated by clicking from this campaign complete a key event (like purchase) in their first or any subsequent visit.
This dimension is only available in the Advertising reports, Explorations, Looker Studio (Google’s free data visualization tool), or the GA4 API and is only compatible with key event metrics. “Campaign” uses Google’s data-driven attribution model to assign partial credit for a conversion across multiple touchpoints. It will not show results for any sessions that didn’t include a key event.
Campaign + sessions: the number of sessions clicking through this campaign that included a key event
Campaign + purchases: the number of purchases attributed to a campaign based on the data-driven attribution model
Campaign + session key event rate: this will always be 100%
You’ll find each scope for all traffic source dimensions, including source, medium, channel, content, term, and id. For example: Session source / medium, First user source / medium, Source / medium, etc.
Mixing dimensions of different scopes can lead to messy data and incorrect conclusions. Here I’m trying to understand the conversion rate for certain traffic sources, but my key event rate is 100%.
Can you see why?
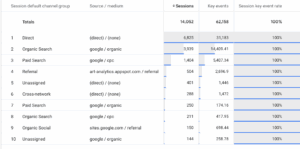
Since only sessions that include a key event will be associated with the “source / medium” dimension, the session key event rate will always be 100%. If I want to understand how many visits originated from a certain source and what share of those visits then included a key event, I need to use only sessions-scoped dimensions, like this:

In the vast majority of cases, I would default to the Session dimensions. These offer the simplest view of the data and the best parallel to what you might be used to looking at in Universal Analytics.
GA4 can feel overwhelming, but it doesn’t have to be. Capacity specializes in helping arts and cultural organizations demystify their website data, ensuring your analytics align with your marketing goals. Ready to make smarter, data-driven decisions? Let’s work together to optimize your tracking and insights.
Decode Now
![Managing User Consent On Your Website [Updated 2025]](https://capacityinteractive.com/wp-content/uploads/2026/04/2026-Blog-Header-Brand-Redesign-JB-copy-36-scaled-848x478.jpg)