Don’t Sleep on this NEA Data Treasure Trove
As you know, we at Capacity Interactive are all about data. So you can imagine our excitement at TLCC2024’s Innovator Series upon seeing Sunil Iyengar from the National Endowment for the Arts (NEA) present on the wealth of research and data available to arts organizations via the NEA.
The NEA prioritizes four research questions, including:
1. What are the measurable impacts of the arts on the following outcome areas?
- Health and wellness for individuals
- Cognition and learning
- Economic growth and innovation
2. In what ways do the arts contribute to the healing and revitalization of communities?
3. What is the state of diversity, equity, inclusion, and accessibility in the arts?
4. How is the U.S. arts ecosystem adapting and responding to social, economic, and technological changes and challenges to the sector?
We’ve been digging right in, ourselves. Here are some of the most compelling stats and studies we’d recommend.
THE ARTS’ ECONOMIC CONTRIBUTION
This press release summarizes a national study and state-by-state breakdown looking at GDP contribution from 2017-2022. Spoiler alert: arts and cultural industries hit an all-time high in 2022 by contributing $1.1 trillion (yes, with a T) to the U.S. economy.
- Listen: Chris Brown of Orlando Family Stage talked about the arts’ economic impact in Florida on our Sept 12 episode of CI to Eye.
In our day-to-day, it can be hard to feel like a post-pandemic comeback has been made. And, true, “growth was not sector-wide, with performing arts organizations, non-government museums, and arts-related construction among the arts industries that have yet to reach their pre-pandemic levels of economic value.” But overall, since the pre-pandemic year of 2019, arts and cultural industries have surged by 13.6%. By contrast, the U.S. economy grew by just 5.5% over the same period.
- Note: According to Statista, the 2023 impact of “Arts, entertainment, recreation, accommodation, and food services,” is 4.5% of the U.S. gross domestic product (GDP), outpacing construction, transportation and warehousing, utilities, mining, and agriculture.
PARTICIPATION PATTERNS
Check out this study for broad audience insights. A couple of highlights:
- In 2022, more than half (52%) of adults aged 18 and over reported personally creating or performing any type of art over the last year. 29% learned an art form or subject.
- Just under half (48%) of all adults attended at least one arts event in person.
- For performing arts attendance categories that saw increases between 2017 and 2022, the attendance increases were most substantial amongst people aged 25-44. The increase was 80% for people aged 35-44.
WORD OF MOUTH…AND SOCIAL MEDIA
We’ll just leave you with this to validate your marketing strategy to promote shareable content on social media:
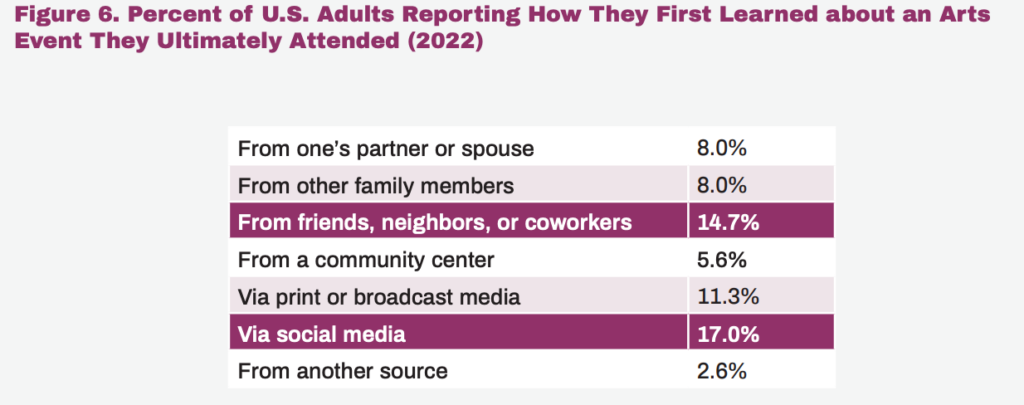 Source: Who Attends Arts Events In Person?
HOW CAN I USE THIS?
The data on economic contribution can be incredibly powerful in speaking to donors, board members, and grant-making organizations. The data relating to which communities may be interested in your programming and how folks hear about arts events can inform your marketing planning. There’s a world of opportunity here!
This research is reliable, empowering, and in some cases, validating. We highly recommend exploring it further (and stay tuned on the blog as we keep an eye out for updates!).
CRAVING EVEN MORE DATA?
Get insights into YOUR organization’s social/digital media performance (and opportunities!) with our 2024 Cultural Compass digital marketing benchmark study.