Most people who have spent enough time in Google Analytics have encountered bot or spam data. Why? A common reason is bots that crawl our sites inadvertently get tracked, and Google Analytics captures undesired data.
We want GA to reflect user behavior—that’s it. And while we mostly rely on Google to handle the technical piece of identifying bots and filtering them out, there are times when they don’t do a good enough job.
The Result:
Distorted overall site KPIs like traffic volume, engagement rates, and conversion rates.
So how will you know if there’s bot traffic in your data? The general symptoms to look for are very low engagement metrics and irregular traffic patterns.
Let’s go through an example.
Traffic trends
Some businesses will experience natural peaks and valleys in their traffic by day of the week. For example, as a B2B business, CI’s site gets more traffic on weekdays. But most of our clients shouldn’t see anything this dramatic in their traffic trends.
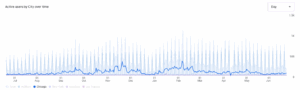
Here is an example of traffic trends with normal fluctuation:
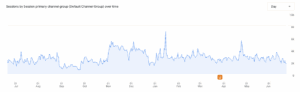
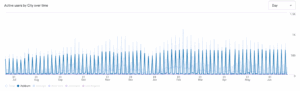
⚠️ Here is an example of a traffic trend that might be a yellow flag. It’s kind of subtle, but you can start to notice the peaks are a bit more dramatic and more regular:

Traffic Source & Direct Traffic
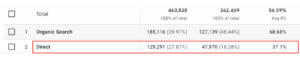
The next step is to look at the traffic sources in your Traffic Acquisition report. Most often, bot traffic will be categorized as “Direct,” meaning Google has no information about where the user was before they arrived at your site. (For more on Direct traffic see our series on Decoding GA4)
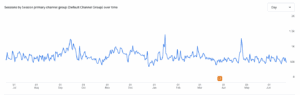
Here is the trend of Direct traffic for the first site:
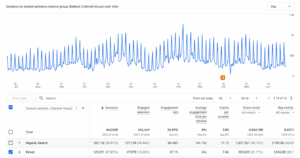
Here is the trend of Direct traffic for the second site: now those irregular peaks are pretty dramatic!
Engagement Rate
In addition to regular spikes in traffic, a low engagement rate is another yellow flag suggesting that the traffic might be bots. An engaged visit includes more than one page, lasts longer than 10 seconds, or includes a key event. So, a low engagement rate typically means that visitors aren’t sticking around on the site.
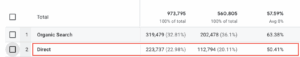
Typical site engagement rates are between 50 – 65%. It can be normal for acquisition-focused campaigns to have lower engagement rates, but Direct traffic should be within the average range for your site.
Here is the engagement rate for Direct vs. Organic Search for our first site. Notice Direct is slightly lower than the site total and Organic Search, but not dramatically so.
Here is the engagement rate for Direct vs. Organic Search for the second site, where the engagement rate is significantly lower—another yellow flag.
Breakdown by Region
One of the most common ways we’ve seen this issue manifest itself with many clients is traffic from Ashburn, VA. Ashburn happens to be known as the Data Center Capital of the World, with data centers for companies like Google, Meta, and AWS (Amazon). Some bots and other crawlers are utilizing these companies’ cloud infrastructure and some of that traffic is being routed via Ashburn.
Let’s break down that Direct traffic by region for the site we’ve been looking at using the Demographic Details report.
This is a Chicago-based organization, and the trend of traffic from Chicago looks normal:
🚩🚩🚩🚩🚩Here is the trend of traffic from Ashburn!
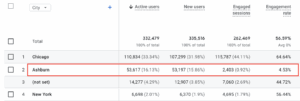
In the table, we can see Ashburn, VA is the #1 city driving Direct traffic, but this client is based in Chicago! And look at that engagement rate: 1.5% vs. the site average we saw in our previous screenshot of 57%!
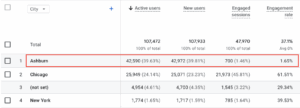
Looking overall—not just at direct traffic—we can see Ashburn is the second city driving traffic to the site, responsible for ~16% of the overall site traffic. That traffic has an engagement rate of just 4.5%.
Clearly here we’ve identified some spam/bot traffic that’s distorting our overall site traffic and KPIs.
How to work around this issue
You’ll want to identify when this traffic began. It may be worth reaching out to your webmaster, developer, or IT team to try to identify if an uptick in bot/spam traffic corresponds with any changes made on the back end of your site. But in our experience, this can be hard to track down.
So now what?
If you do nothing, you’ll be comparing against distorted overall site KPIs like traffic volume, engagement rate, and conversion rates.
Google doesn’t let us prevent capturing this data. It will make its way into our datasets, so the best we can do is filter it out.
- In the reporting interface, you can edit each report and include a filter to exclude Ashburn.
- Be sure to add a filter to every Exploration that you build (if you’re not using Explorations, don’t worry about this).
- In your dashboards (e.g. in Looker Studio), add the filter on a page level so that all widgets are updated.
Bonus:
In keeping with the desire to only capture user behavior, you might want to filter out your team’s data – the way you use the website is not reflective of how your patrons do. Here’s Google’s tutorial on how to set this up.
Not sure if you’ve got this set up quite right? Running into other challenges? Don’t hesitate to reach out to us directly.